vpp-exporter
Prometheus metrics exporter — reads VPP's stats segment and serves per-application metrics for Grafana.
vpp-exporter is a Go binary that reads vpp-ndpi classification statistics from VPP’s stats segment (shared memory, no IPC overhead) and serves them as Prometheus metrics on :9197/metrics.
Status
Open-source. Active development. Apache 2.0.
Running with Docker Compose
services:
  vpp:
    image: vpp-ndpi-ci
    volumes:
      - vpp-stats:/run/vpp

  vpp-exporter:
    image: vpp-exporter
    command: ["--stats-socket=/run/vpp/stats.sock", "--listen=:9197"]
    volumes:
      - vpp-stats:/run/vpp:ro
    ports:
      - "9197:9197"

volumes:
  vpp-stats:
Prometheus metrics
| Metric | Type | Description |
|---|---|---|
vpp_ndpi_flows_created_total | counter | Total flows inserted |
vpp_ndpi_flows_classified_total | counter | Flows with a final verdict |
vpp_ndpi_flows_active | gauge | Current active flow count |
vpp_ndpi_packets_scanned_total | counter | Packets sent to nDPI |
vpp_ndpi_packets_cached_total | counter | Packets on the fast path |
vpp_ndpi_app_bytes_total{app="YouTube"} | counter | Per-app byte counter |
vpp_ndpi_app_packets_total{app="YouTube"} | counter | Per-app packet counter |
vpp_ndpi_app_flows_total{app="YouTube"} | counter | Per-app flow counter |
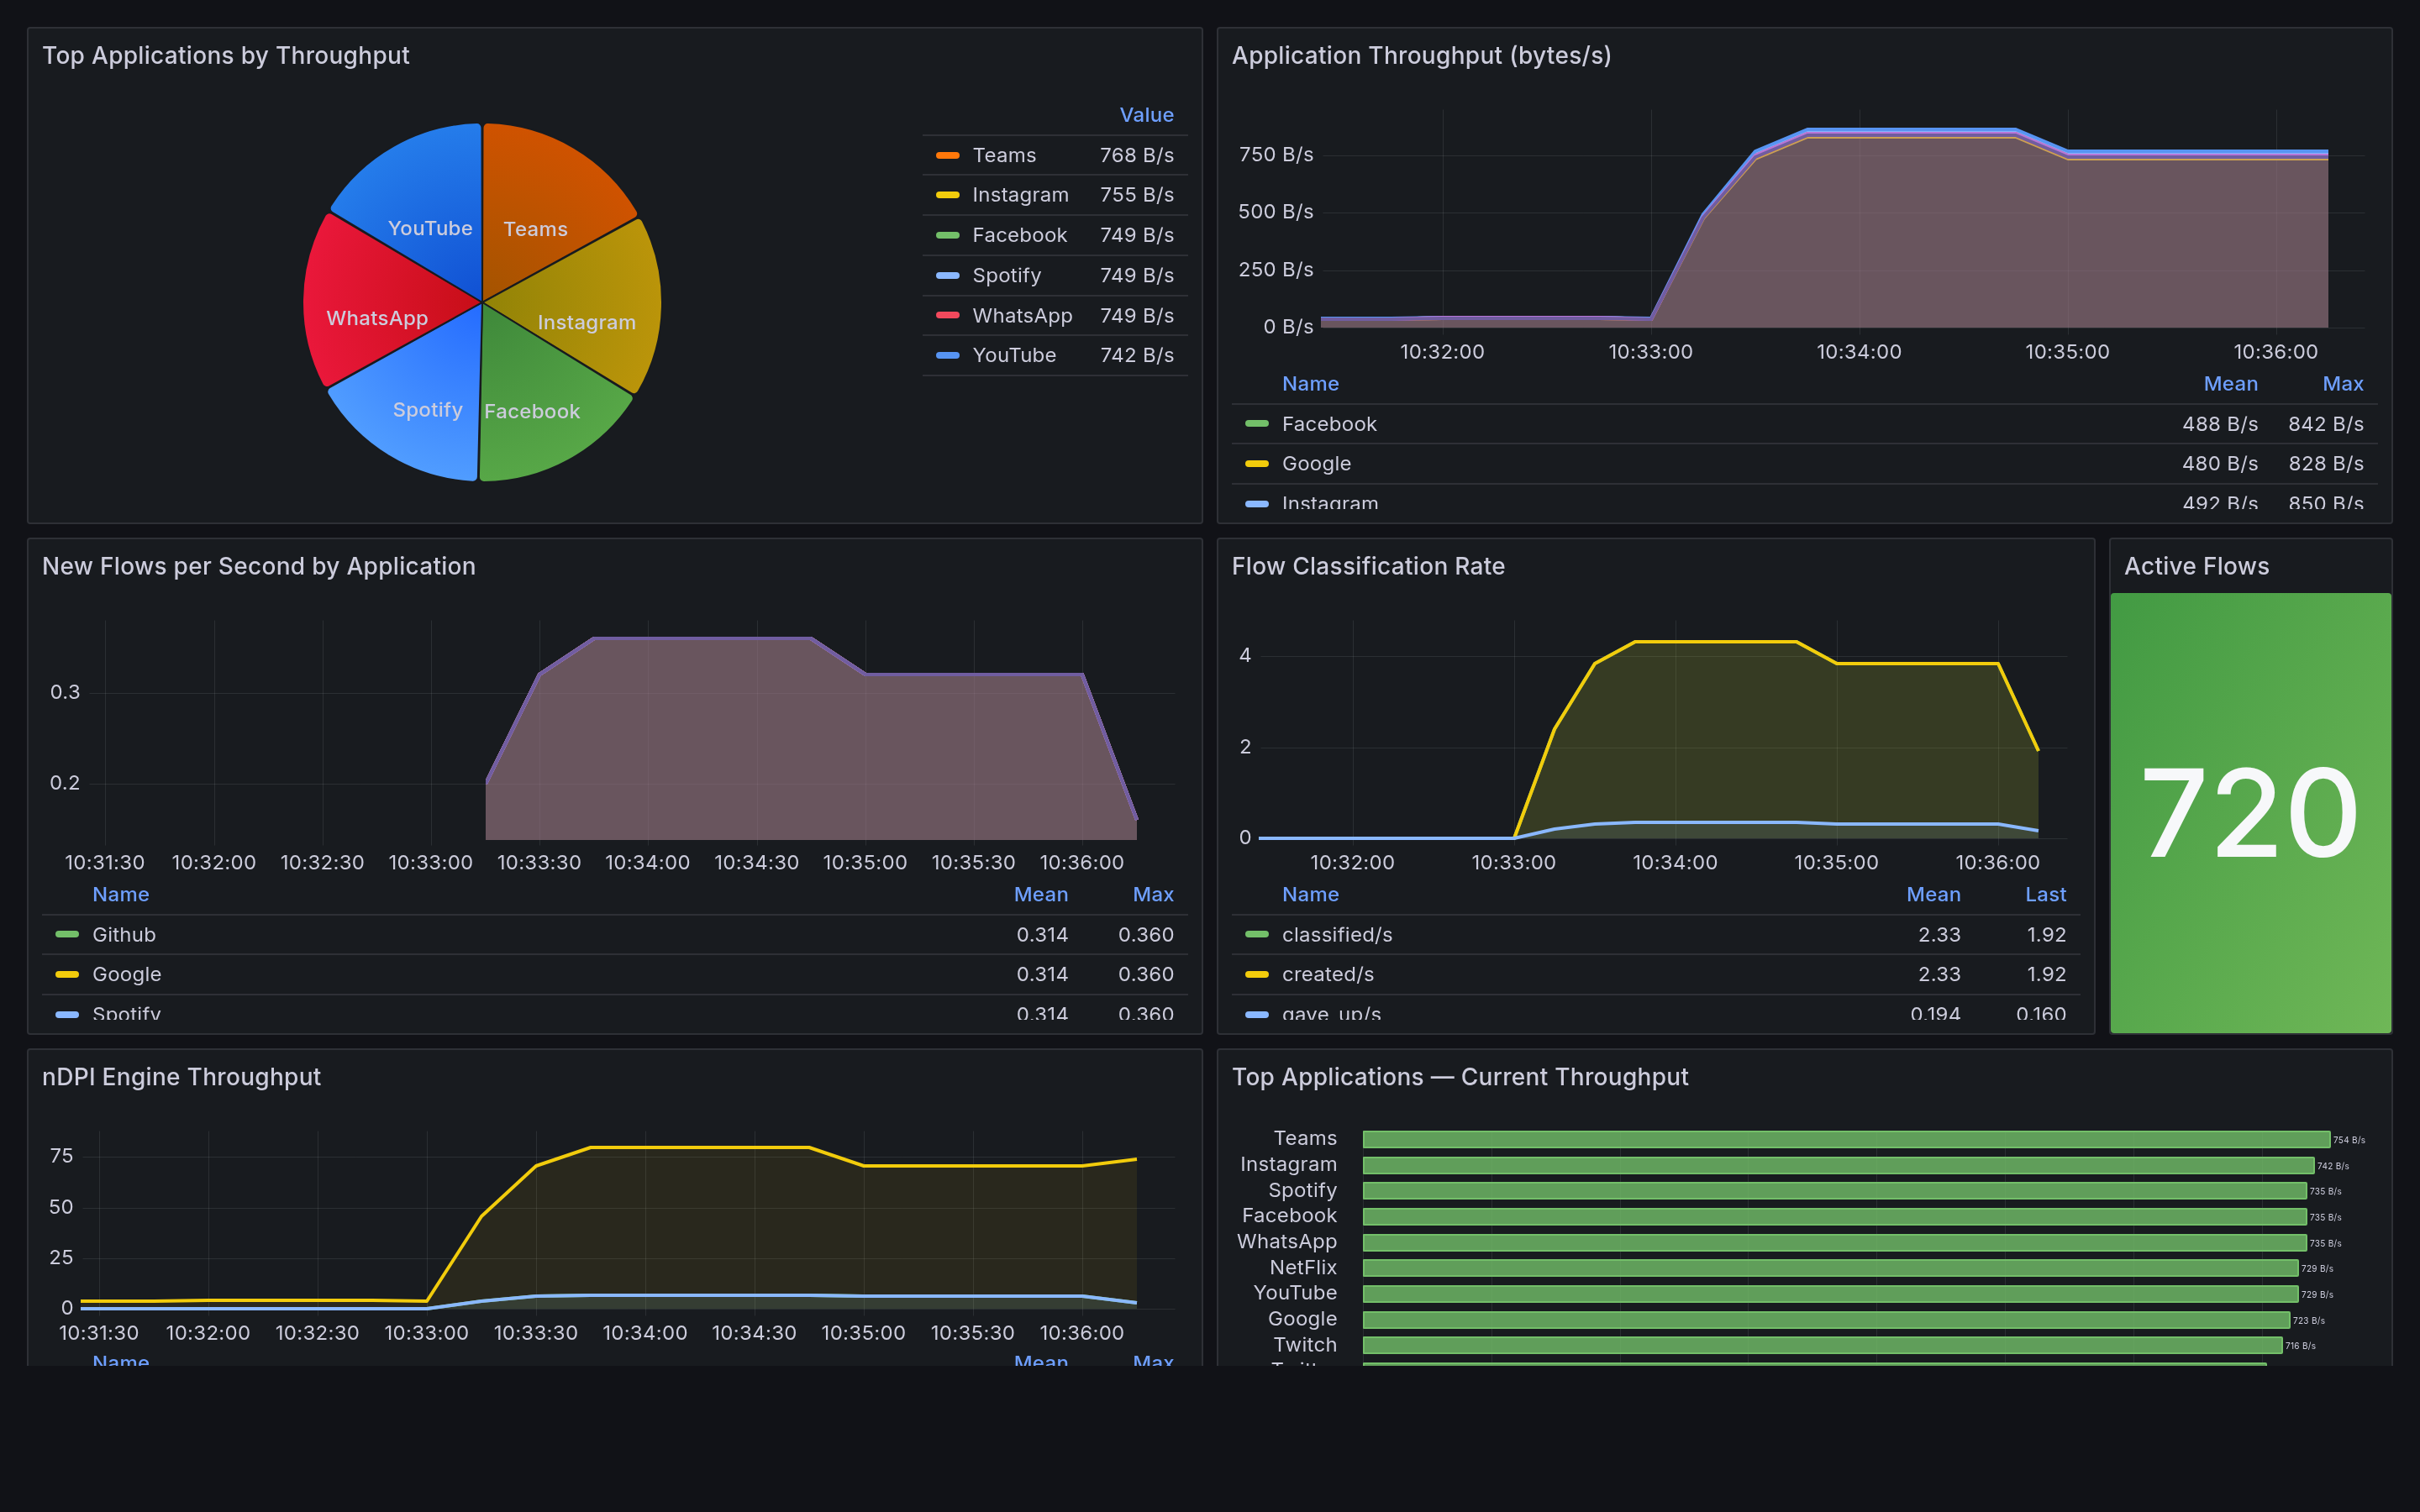
Grafana dashboard
The included dashboard provides:
- Top applications by throughput (pie chart)
- Application throughput time series
- New flows per second by application
- Flow classification rate (classified/s, created/s, gave_up/s)
- nDPI engine throughput (scanned/s, cached/s, ndpi_calls/s)
- Top applications horizontal bar chart (current snapshot)
- Active flows stat panel
Source
exporter/ — available via PacketFlow.