See and protect every application flowing through VPP.
PacketLens is an open-source DPI, DDoS protection, and call intelligence plugin suite for FD.io VPP. It classifies 300+ applications, detects volumetric attacks per-IP, blocks SYN floods at 10M+ SYN/s per core, protects VoIP carriers from SIP floods and RTP bursts, and applies a three-tier spam filter to flag suspicious calls for transcription and enforcement — all inside the data plane, at line rate, with zero hardware changes.
What PacketLens does
App classification
Identifies 300+ protocols — YouTube, Zoom, Netflix, SIP, RTP, DNS, TLS, QUIC, GTP-U, BitTorrent — using nDPI. SNI extraction, JA3 fingerprinting, risk scoring. Under 8 ns per cached flow.
Per-app policy
Drop or permit traffic by application class. Rules installed at runtime via CLI or binary API — no restarts, no config files. set policy app BitTorrent action drop.
Per-app rate limiting
Token-bucket policer per application. Cap YouTube to 5 Mbps, DSCP-mark excess for downstream QoS — all in the forwarding path. set policer-ndpi app YouTube rate 5M.
IPFIX / NetFlow export
RFC 7011 flow records enriched with application name, category, TLS SNI, and JA3 fingerprint. Sends to any collector — ntopng, Elasticsearch, Splunk, or custom pipeline.
Prometheus metrics
Per-application packet, byte, and flow counters scraped directly from VPP's stats segment. Grafana dashboard included — zero extra config.
Per-IP DDoS detection
Tracks PPS and BPS per destination and source IP inside VPP. Threshold crossed → scrub rule auto-installs inline in under 1 second. Drop, rate-limit, or push BGP FlowSpec to the upstream PE.
VoIP flood protection
Per-method SIP flood detection — independent thresholds for INVITE, REGISTER, and OPTIONS floods. RTP burst detection runs in parallel. Carrier CIDR whitelist prevents blocking legitimate SIP trunks. Blocked sources rate-limited or dropped inline in < 1 second. Combine with vpp-rtp-asr to score RTP audio for spam and block confirmed robocall sources in under 1 second.
Spam & robocall detection — selective transcription
vpp-rtp-asr applies a three-tier filter to RTP audio: keyword spotting, audio heuristics (WPM, energy variance, silence ratio), and per-session score accumulation. Suspicious calls are flagged for transcription via Moonshine ASR — no external recorder, no SIP signaling dependency.
BGP FlowSpec push
When a threshold fires, VPP announces a FlowSpec NLRI to your upstream PE router via embedded GoBGP — stopping the attack before it reaches your router. No manual BGP config.
BGP FlowSpec receive
VPP as an inline scrubbing center. Accepts RFC 8955 FlowSpec rules from FRR, Juniper, or Cisco and enforces drop or rate-limit in the data plane instantly.
SYN proxy
Stateless SYN cookie proxy — intercepts SYN floods, validates clients via crc32c cookie, proxies only legitimate connections to the backend. Target: 10M+ SYN/s per core.
AI-ready enforcement plane
Register any AI/ML threat-scoring function as a callback. PacketLens calls your model once per new flow and drops or rate-limits high-score source IPs inline — detection to enforcement in under 1 ms, no BGP round-trip required. Pair with vpp-rtp-asr transcripts to run speech-based spam classifiers per call.
SIP CDR export to Homer
Mirrors every SIP packet to Homer SIPCapture via HEP3 — the same protocol used by SBCs and SIP proxies. INVITE, 200 OK, BYE, and all SIP methods land in Homer's call search in real time. set cdr hep server 10.0.0.5 port 9060.
Inside the data plane, not next to it
Commercial DPI appliances sit next to your router on a mirror port. They cost $80K–$300K per chassis, require dedicated hardware, and add an extra hop to your management plane.
PacketLens runs inside VPP itself, as a feature arc node on ip4-unicast. Classification happens in nanoseconds, on the same CPU core as your forwarding path. No mirror port. No extra server. No per-Gbps license.
VPP is the forwarding engine behind 100G–800G production deployments at ISPs and carriers. PacketLens inherits that scale — DPI is not a bottleneck because it adds only < 8 ns per cached packet on the fast path.
Get in touch →$200K
+ ndpi-observe
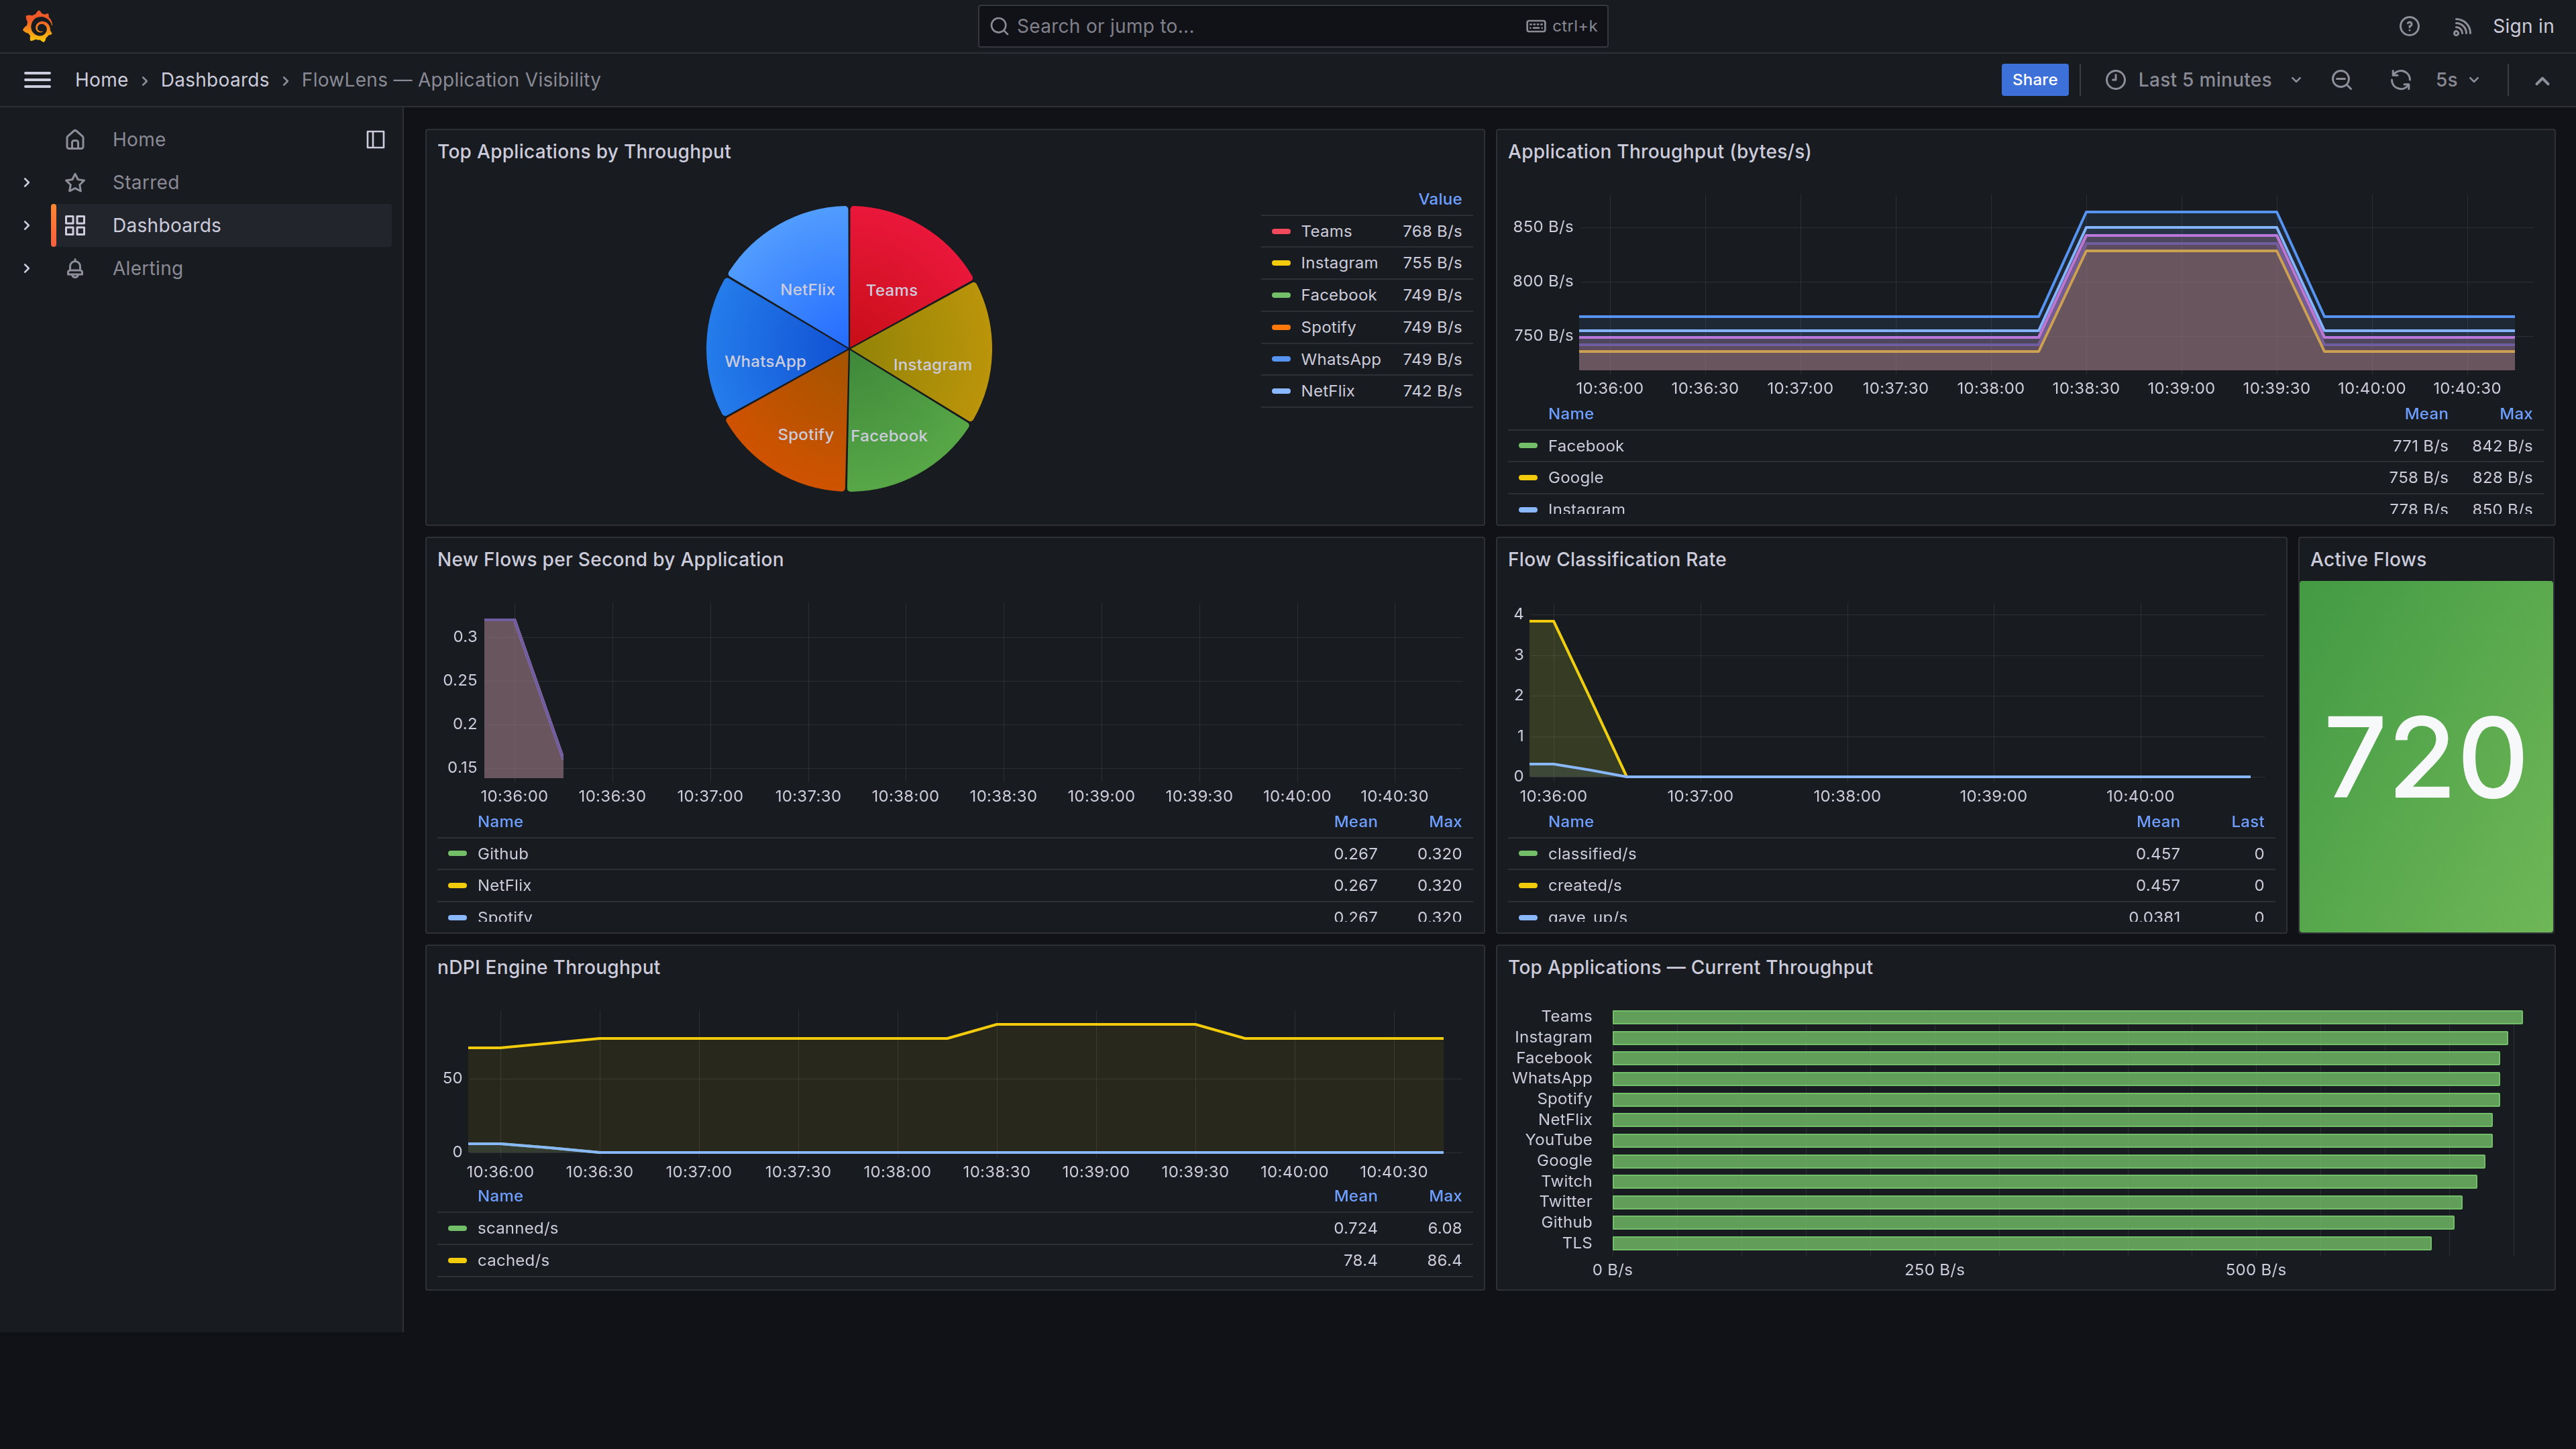
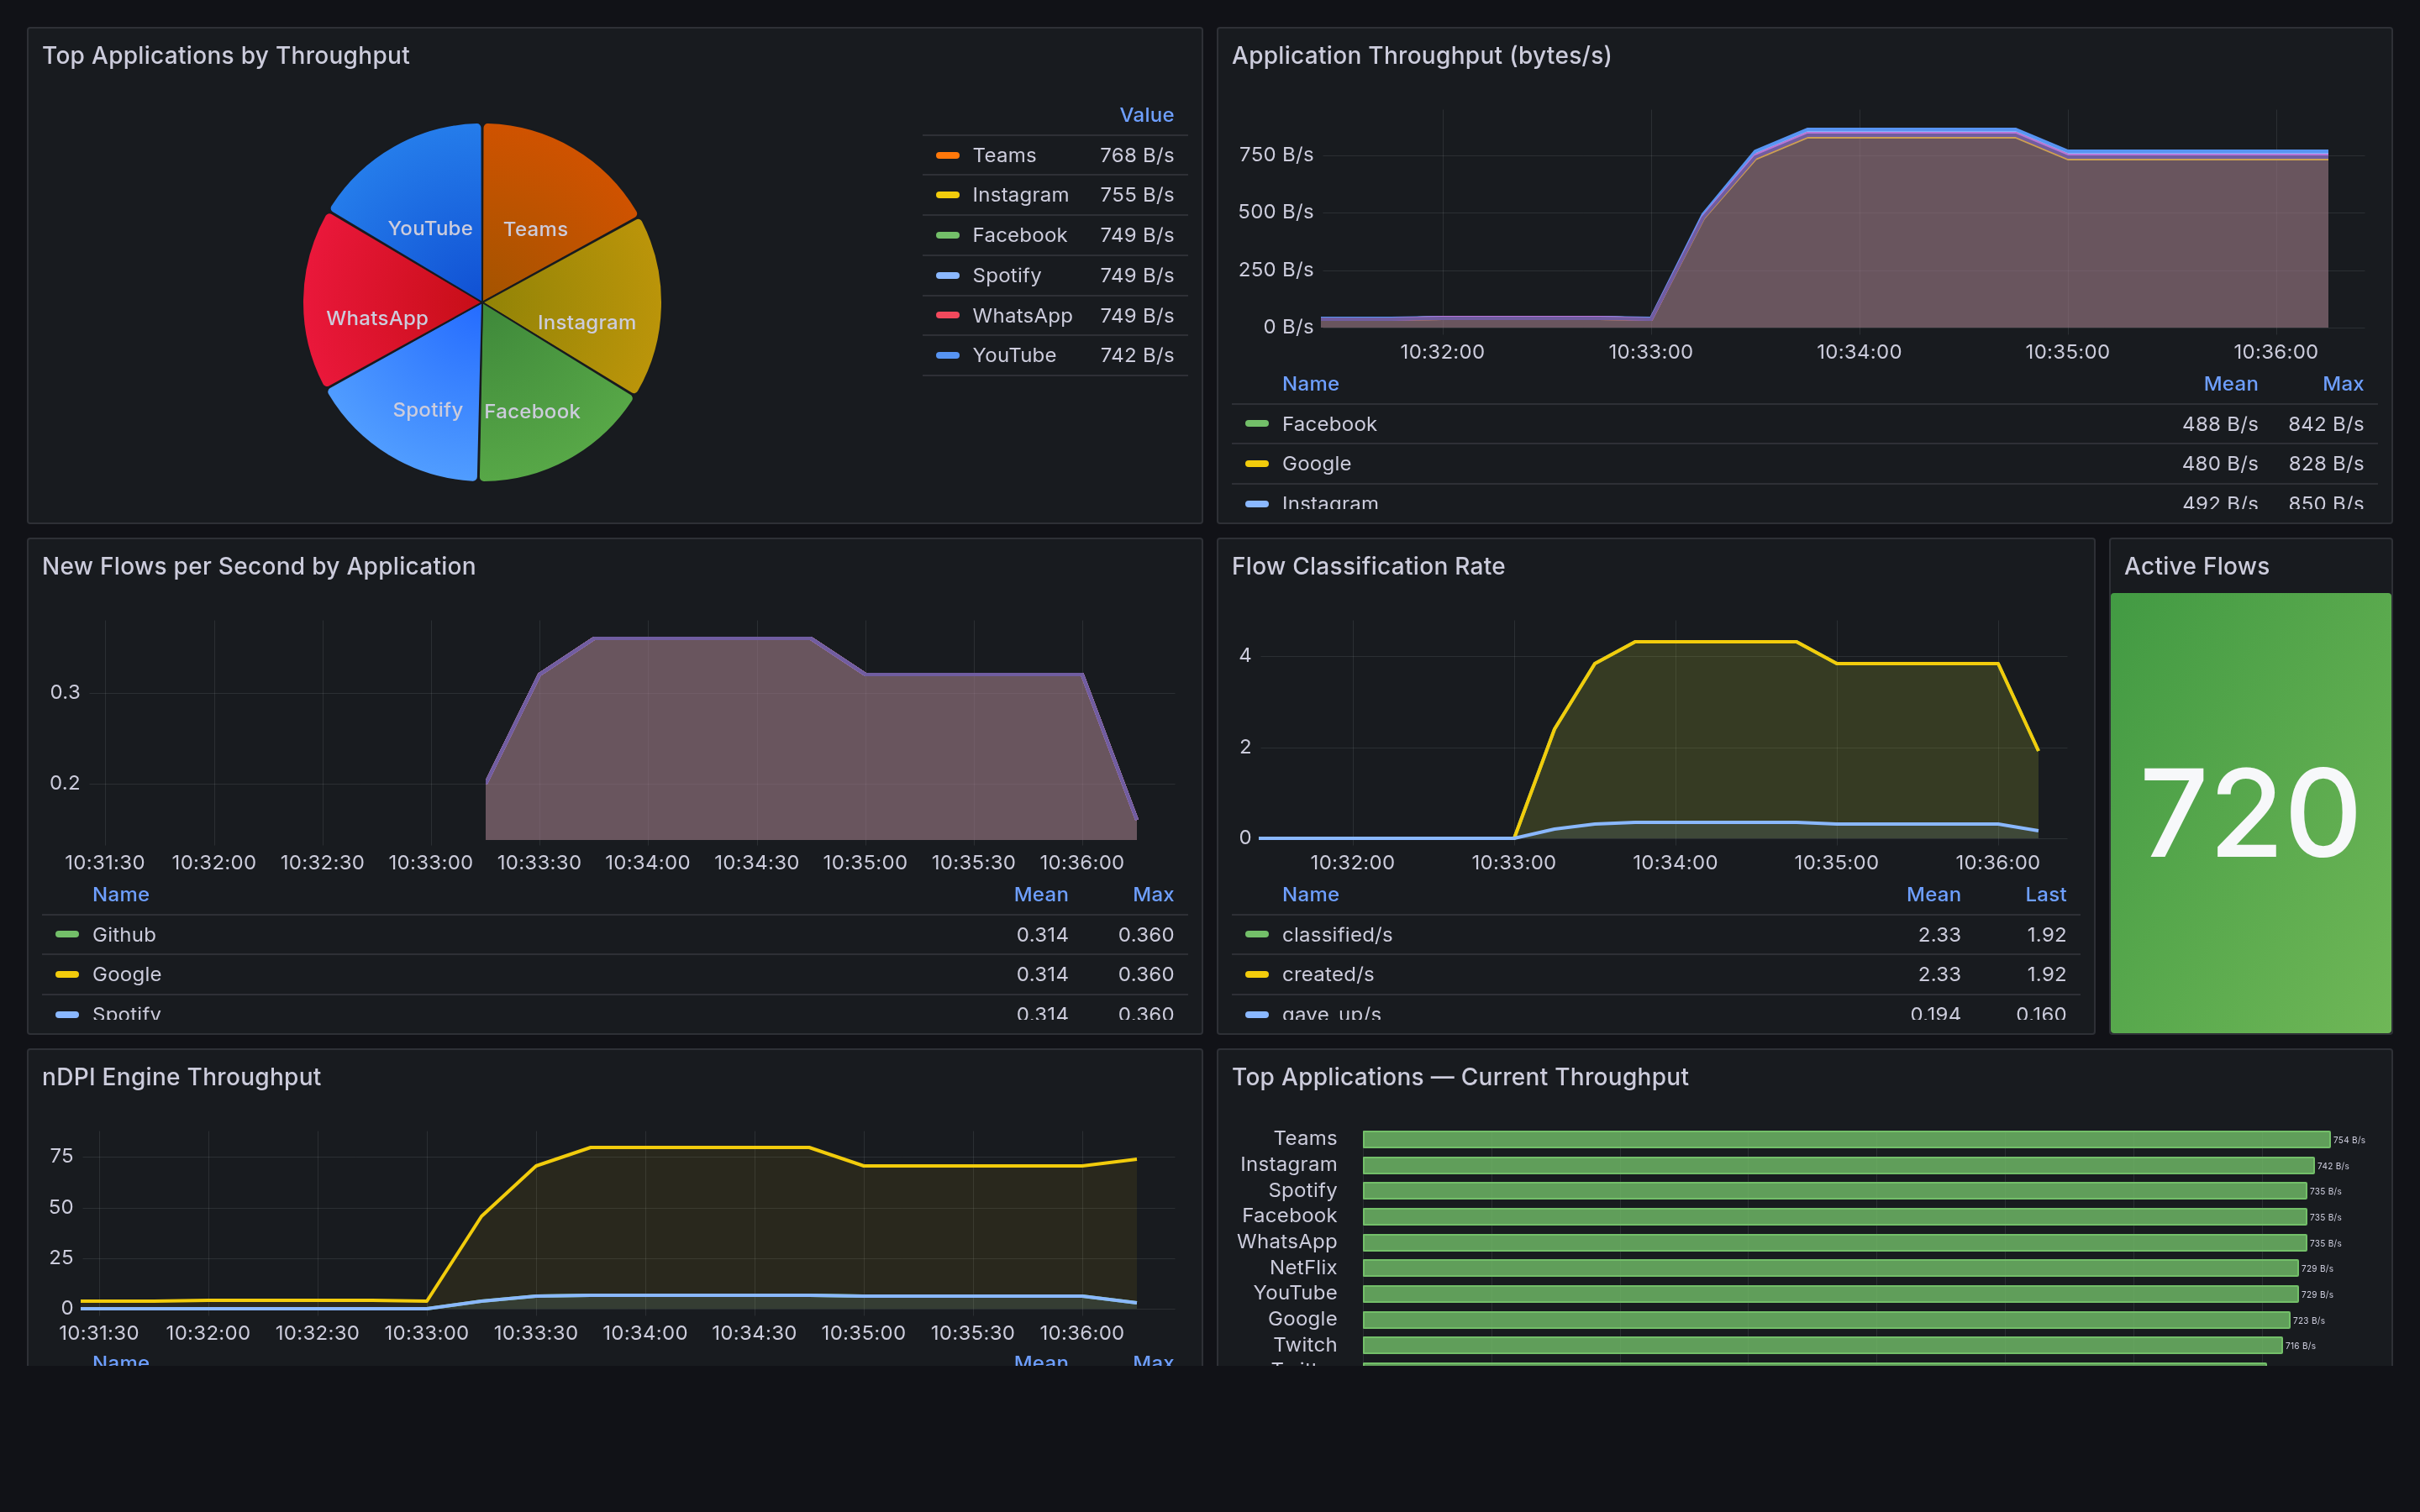
Live application visibility in Grafana
The included Grafana dashboard shows real-time application traffic — throughput, flow rates, and engine metrics — scraped from VPP's stats segment via Prometheus.
Application classification in action
Watch nDPI classify live traffic in real time — YouTube, DNS, TLS, HTTP/2, and more appear in show ndpi applications as the engine identifies each flow. Per-application packet and byte counters tick up live alongside each verdict.
IPFIX export to any collector
PacketLens exports RFC 7011 IPFIX flow records enriched with nDPI metadata — application name, category, TLS SNI, and JA3 fingerprint. Any standard IPFIX/NetFlow collector can consume the stream.
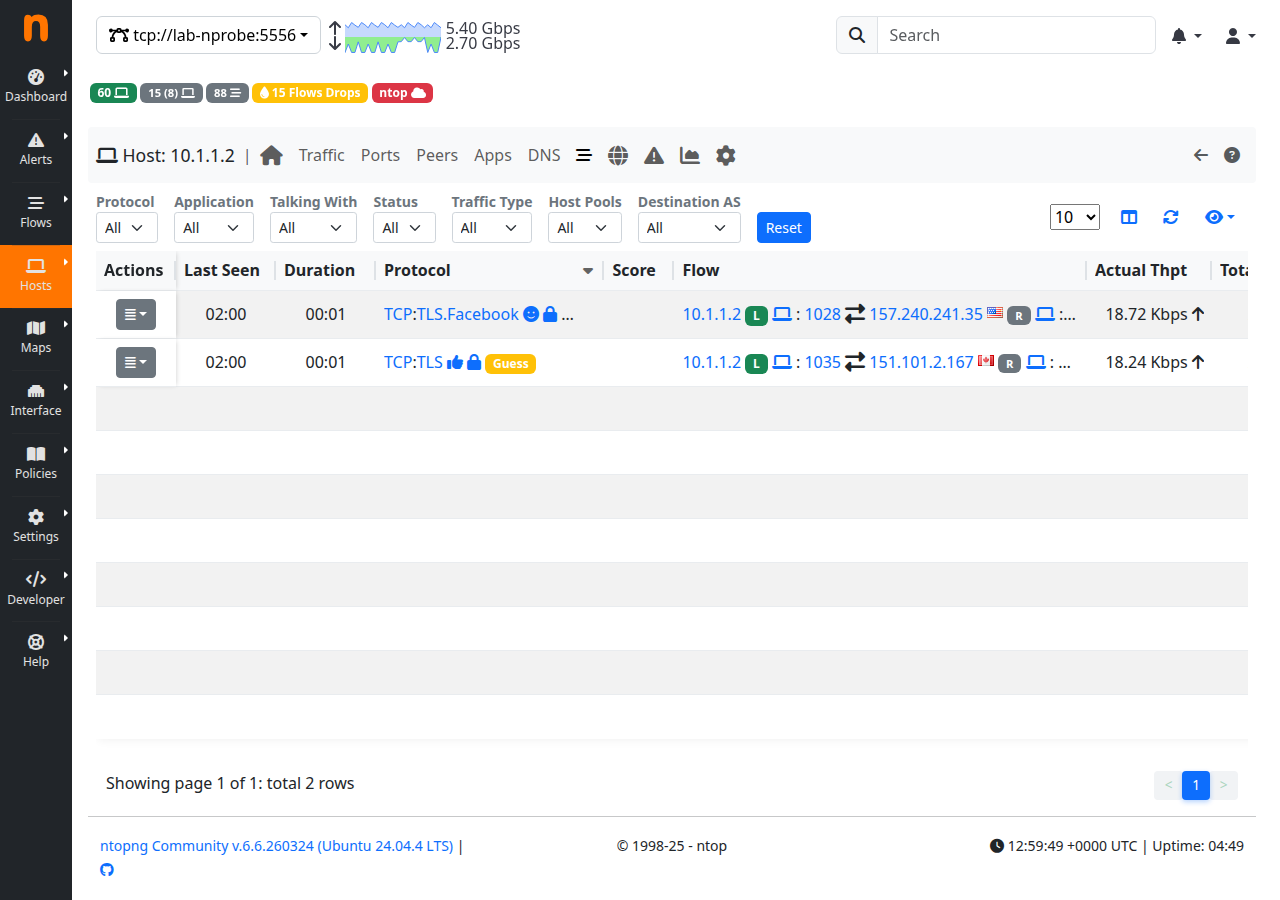
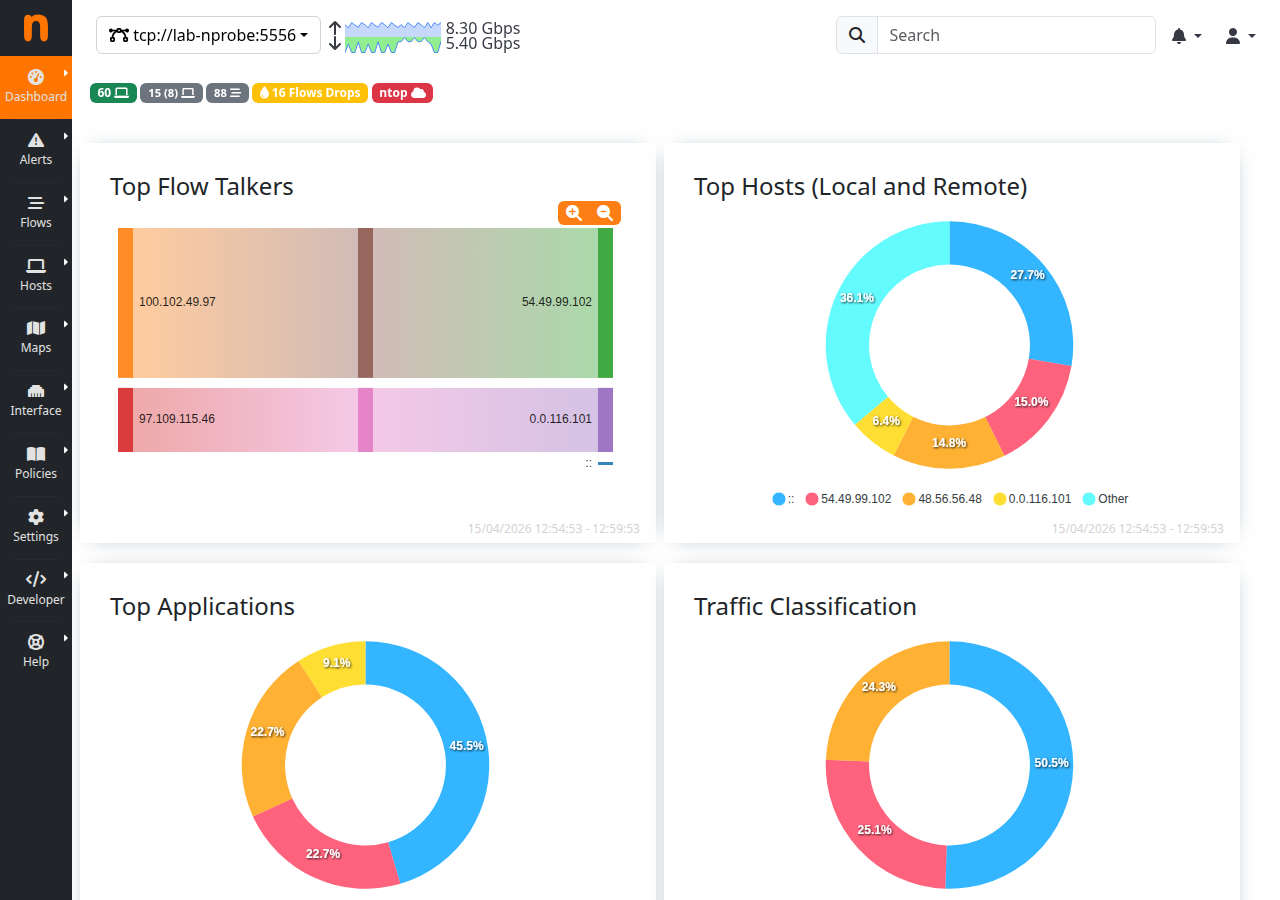
ntopng dashboard
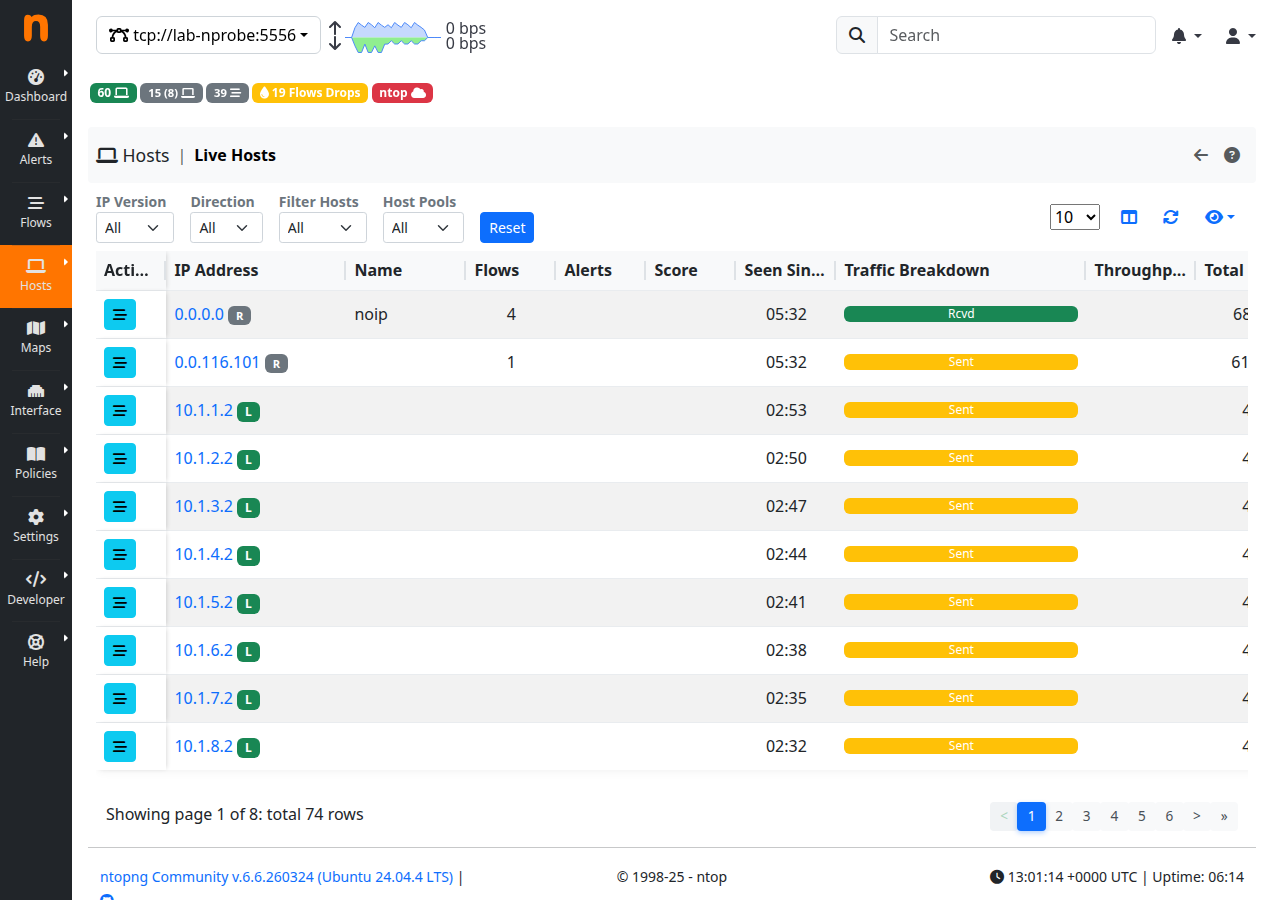
Per-host breakdown
Lab stack: VPP → IPFIX UDP/2055 → nProbe → ZMQ → ntopng.
SIP CDR export to Homer SIPCapture
vpp-cdr mirrors every SIP packet to Homer SIPCapture via HEP3 — the same protocol used by SBCs and SIP proxies. INVITE, 100 Trying, 180 Ringing, 200 OK, ACK, BYE — every SIP message in every call lands in Homer's call search in real time, enriched with timestamps and flow metadata.
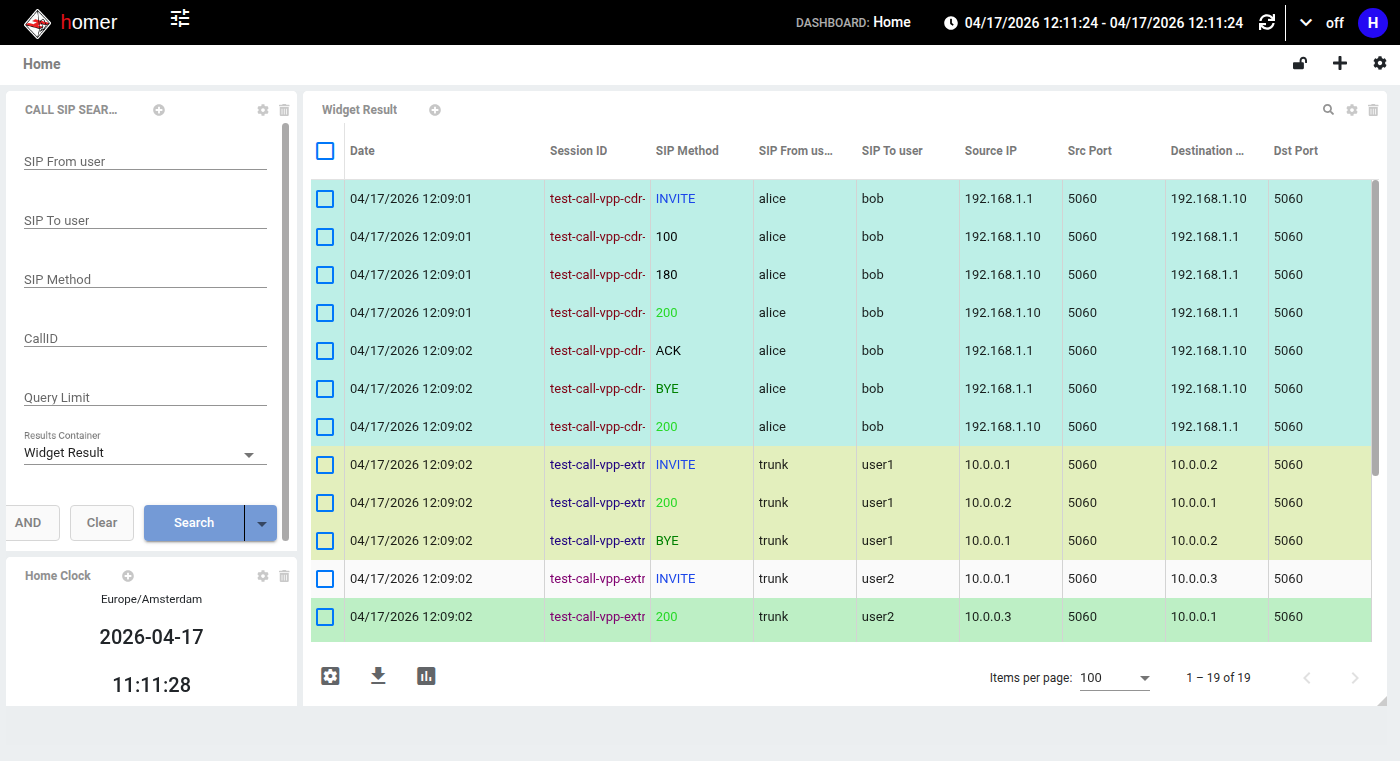
Homer dashboard — 19 SIP messages from 5 concurrent calls captured via HEP3. Two commands: set cdr hep server 10.0.0.5 port 9060 + set interface cdr enable eth0.
BGP FlowSpec enforcement — automatic upstream mitigation
When vpp-ndpi detects an application threshold crossing, vpp-flowspec automatically pushes BGP FlowSpec rules to your upstream router via embedded GoBGP. YouTube hitting 500 B/s? FRR rate-limits it before it reaches VPP.
Lab stack: VPP + nDPI → Unix socket → flowspec-ctrl (GoBGP) → BGP session → FRR PE.
BGP FlowSpec receive — VPP as scrubbing center
vpp-flowspec-recv closes the loop: an upstream controller (FRR, Juniper, Cisco) announces FlowSpec rules via BGP, and VPP installs them in its data plane instantly — drop or rate-limit matching traffic before it reaches downstream hosts.
Lab stack: FRR PE (AS 65000) → BGP session → flowspec-recv sidecar (AS 65002) → Unix socket → VPP data plane.
Per-IP DDoS detection — inline scrubbing in under 1 second
vpp-ddos tracks packets-per-second and bits-per-second for every destination IP and source IP directly inside VPP. When a configured threshold is crossed, a scrub rule installs automatically — dropping or rate-limiting attack traffic inline, with no external tool or BGP round-trip required.
Left: threshold fires (Active=YES, Crossings=3) · Right: 10.1.0.5/32 scrub rule auto-installs, dropping 7.4M attack packets inline.
DDoS → BGP FlowSpec — upstream mitigation via FRR
When a per-IP threshold crosses, vpp-ddos also sends a BGP FlowSpec announce to the upstream PE router via flowspec-ctrl (embedded GoBGP). The PE installs a drop rule for the attacker prefixes — stopping the attack traffic before it even reaches your router. No manual BGP config, no external tool, no extra latency loop.
Left: vpp-ddos threshold fires (announces: 1) · Right: FRR receives attacker prefixes from AS 65001 with FS:action eval stops (drop).
Stateless SYN proxy — absorb SYN floods at line rate
vpp-ddos includes a stateless SYN cookie proxy running inside VPP's feature arc. The node intercepts TCP SYN packets destined for protected VIPs, replies with a cryptographic SYN-ACK cookie, and only establishes a real backend connection when the client proves it's legit with a valid ACK. The backend server never sees the flood.
Left: set synproxy backend 10.1.0.1 port 80 to 10.1.1.1 port 80 · Right: syns_intercepted: 5 synacks_sent: 5 cookies_invalid: 3 — bots dropped, backends untouched.
VoIP-aware DDoS — per-method SIP flood detection and RTP burst protection
vpp-ddos VoIP mode tracks INVITE, REGISTER, and OPTIONS floods independently — each SIP method gets its own PPS threshold, action, and hold timer. RTP burst detection runs in parallel. Carrier CIDR whitelists prevent blocking legitimate SIP trunks. Blocked sources are rate-limited or dropped in under one second, before the flood reaches any backend. Add vpp-rtp-asr alongside it to score RTP audio for spam by content — keyword hits and synthetic TTS signatures — and automatically block confirmed robocall sources inline.

Left: set ddos voip sip invite pps 50 + sip register pps 20 + carrier whitelist · Right: 203.0.113.5 INVITE flood blocked (11247 pkts dropped), carrier trunk 192.168.10.x passes freely.
Per-app enforcement — drop, permit at wire speed
vpp-policy enforces drop/permit rules inline on the ip4-unicast feature arc. Rules apply only to classified flows — unclassified packets are always permitted so nDPI can finish its verdict.
Two CLI commands to deploy: set interface policy eth0 enable + set policy app BitTorrent action drop.
Per-app rate limiting — drop or DSCP-mark at wire speed
vpp-policer-ndpi attaches a token-bucket policer to each application class. YouTube saturating a link? Cap it to 5 Mbps and DSCP-mark excess packets for downstream QoS — all inside VPP, no separate device.
One command: set policer-ndpi app YouTube rate 5M burst 40K dscp-mark 8.
SIP CDR export — every call captured in Homer
vpp-cdr mirrors SIP packets to Homer SIPCapture via HEP3 — the same protocol used by SBCs and SIP proxies. Every INVITE, 200 OK, BYE lands in Homer's call search in real time. nDPI identifies SIP flows; a port heuristic (5060/5061) handles the rest. The non-blocking UDP socket never stalls the forwarding path. Pair with vpp-rtp-asr to attach a spam score and selective transcript to each CDR entry — flagged calls get both the signaling record and the spoken content.
Two commands: set cdr hep server 10.0.0.5 port 9060 + set interface cdr enable eth0. Homer UI at http://homer:9080.
Three-tier spam filter — flag suspicious calls, transcribe what matters
vpp-rtp-asr intercepts RTP flows inside VPP and runs a three-tier spam detection pipeline entirely in the data-plane worker threads. No external recorder, no SIP signaling dependency — the plugin decodes G.711/G.722/G.729/Opus, resamples to 16 kHz, and scores each 2-second audio segment before deciding whether to emit a full transcript.
Tier 1 — keyword spotting: Moonshine ASR transcribes flagged audio segments and matches against a configurable keyword list ("press 1", "social security", "call now", …). Tier 2 — audio heuristics: silence ratio, energy variance, and words-per-minute consistency catch synthetic TTS voices without any transcript. Tier 3 — session scoring: per-session score accumulates across segments; confirmed spam sources can be handed to vpp-ddos VoIP mode for inline block in under 1 second.
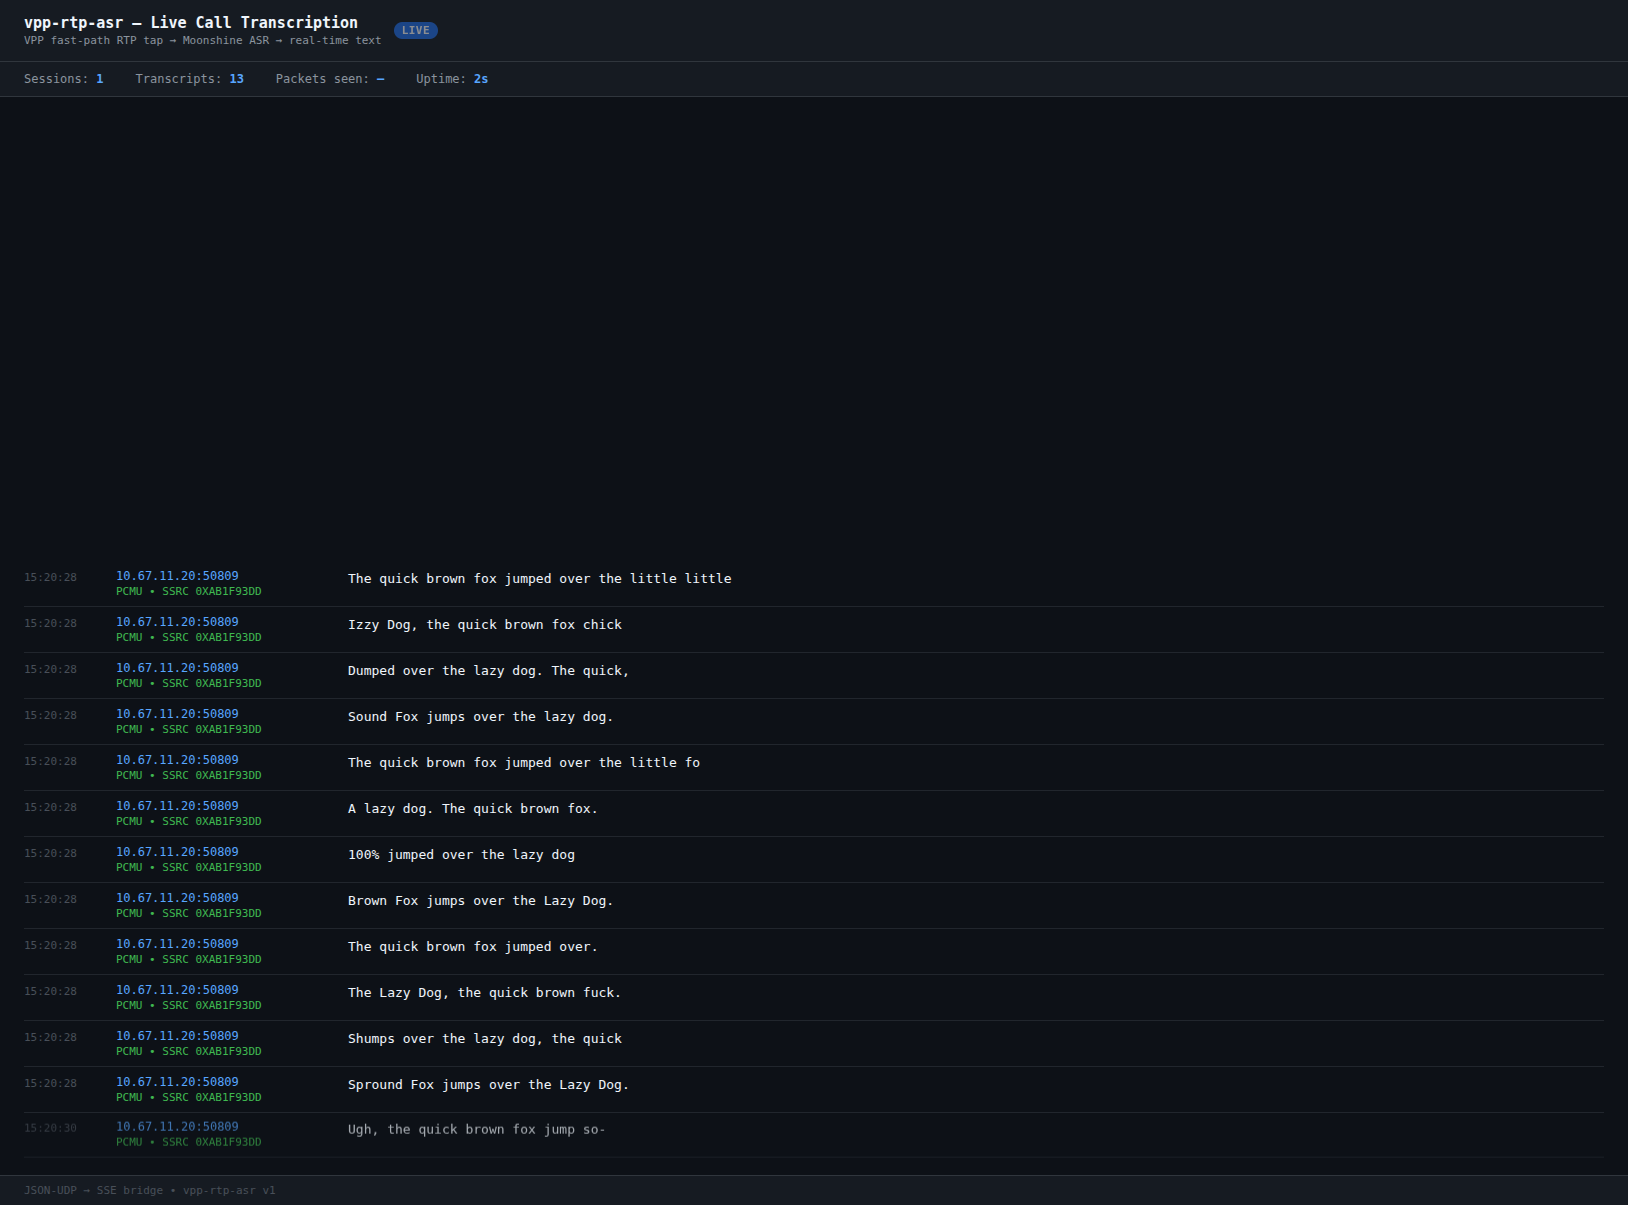
Live demo: Piper TTS → ffmpeg RTP → VPP rtp-asr tap → Moonshine ASR → browser UI. Each row is one 2-second audio segment arriving as JSON-UDP.
show rtp-asr spam — thresholds and matched keywords · show rtp-asr sessions — per-SSRC spam score and decision (clean / SPAM? / SPAM!).
Composable plugin stack
Each plugin registers on the same VPP feature arc. Enable only what you need — the data plane cost is proportional to the plugins you activate.
All PacketLens plugins are open-source (Apache 2.0). Commercial support and custom integration available from PacketFlow.
Performance
| Metric | Value | Condition |
|---|---|---|
| Line rate | 100G–800G | VPP multi-worker, scales linearly |
| Overhead per packet (classifying) | ~150 ns | first 3–8 packets per flow |
| Overhead per packet (cached flow) | ~8 ns | bihash lookup only — invisible at any line rate |
| Flow table lookup | O(1) | per-worker, no locks |
| Max flows per worker | 1M | configurable |
| Classification convergence | 3–8 pkts | 95th pct, TCP/TLS |
| Protocols classified | 300+ | nDPI 4.2.0 |
| DDoS detection latency | < 1 s | vpp-ddos: 1-second tick, scrub rule installed in same process |
| DDoS scrub throughput target | 100G+ | inline drop / token-bucket on ip4-unicast arc |
| SYN proxy | 10M SYN/s target | per core, stateless cookie (crc32c), vs 2M/s for Linux netfilter SYNPROXY |
Built on proven open-source foundations
FD.io VPP
Packet processing framework — 100+ Gbps forwarding, used by Cisco, Ericsson, Nokia, and scores of network vendors. Apache 2.0.
ntop nDPI
Deep packet inspection — 300+ protocols, used by ntopng, Suricata, Zeek, pfSense, and Arkime. LGPL-3.0.
Prometheus + Grafana
Industry-standard metrics and dashboards. Zero-code integration via VPP's stats segment shared memory. Apache 2.0.
Get in touch
Interested in adding PacketLens to your VPP deployment? We'll get back to you within 24 hours.